
Figure 4.
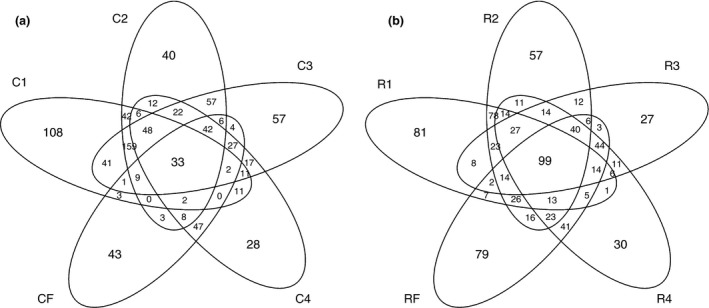
Venn diagrams displaying the distribution of operational taxonomic units (OTUs) among step‐up diets during corn‐adaptation (a) and RAMP‐adaptation (b) to high concentrate diets. C1–C4 represents adaptation steps during corn‐based adaptation; R1–R4 represents adaptation steps during RAMP‐based adaptation. CF and RF represent samples from the same finisher diet.