
Figure 1.
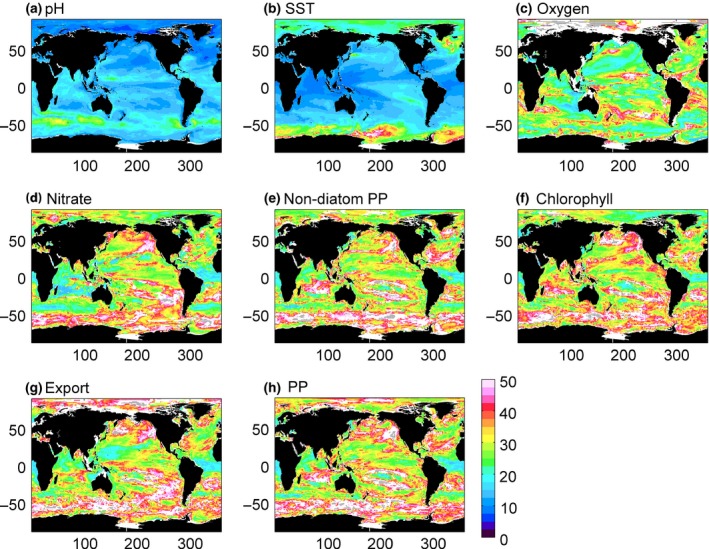
Number of years of data needed to distinguish a climate change‐driven trend from natural variability for (a) pH, (b) SST, (c) oxygen, (d) nitrate, (e) nondiatom PP, (f) chlorophyll, (g) export and (h) PP. White areas are where less than half of the eight models used here agree on the sign of the trend. Grey dots indicate where the climate change trend does not exceed the natural variability in the timeframe of the simulations (95 years).