
Figure 4.
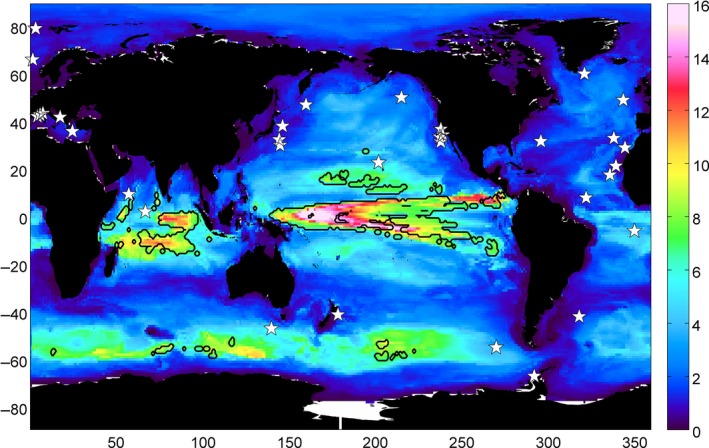
Size of footprint (106 km2) for chlorophyll time series calculated at every grid point, where the footprint is defined as pixels that have similar mean and variability (see Materials and methods). Black contour marks where the footprint is relatively large (>7 × 10⁶ km2) and n* is relatively short (<35 years). White stars mark locations of BGC‐SOs.