
Figure 1. The effects of caffeine on calcium cycling .
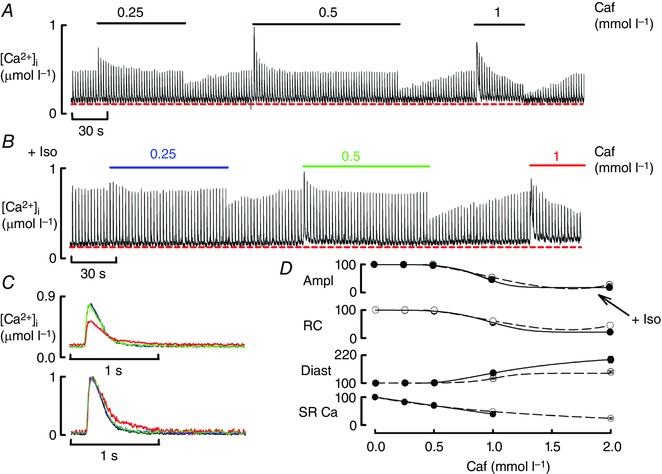
A, caffeine (Caf) was applied at the concentrations indicated (mmol l–1) for the periods shown. B, effects of caffeine in the presence of isoproteronol (ISO, 1 μmol l–1). In both A and B the cell was stimulated at 0.5 Hz. C, specimen Ca transients obtained in control and in the steady state in the presence of caffeine and ISO (concentrations indicated by colours – see B). The top panel shows un‐normalised records and the bottom normalised. D, mean data showing the effects of various caffeine concentrations on (from top to bottom): Ca transient amplitude; rate constant of decay; diastolic Ca; SR Ca content. All data are normalised to values in the absence of caffeine. Points show mean and SEM for 6–8 cells (six rats). The dashed line represents baseline, and continuous line is in the presence of ISO. The amplitude, rate constant and diastolic Ca were significantly different from control (0 caffeine) at caffeine concentrations of 1 mmol l–1 and above. The SR Ca content was significantly decreased at all concentrations of caffeine tested.