
Figure 3. The effects of ryanodine on Ca cycling .
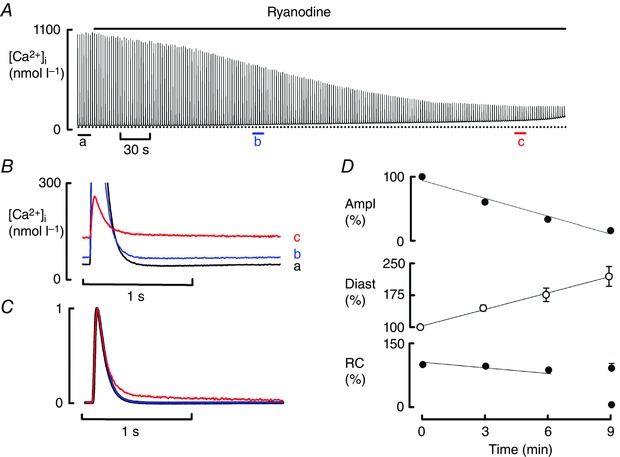
A, time course of the effects of ryanodine (1 μmol l–1). B, specimen, magnified transients to emphasise the change in diastolic [Ca2+]i. C, normalised transients. D, mean data (16 cells, 11 rats) for the time course of change of (from top to bottom): amplitude (Ampl); diastolic Ca (Diast); rate constant (RC) of decay of the Ca transient. The 9 min point shows both fast and slow rate constants. The amplitude of the Ca transient and diastolic Ca were significantly decreased at 3, 6 and 9 min. The rate of decay was only significantly deceased at 9 min (slow phase of decay).