
Figure 4. The effects of thapsigargin on Ca handling .
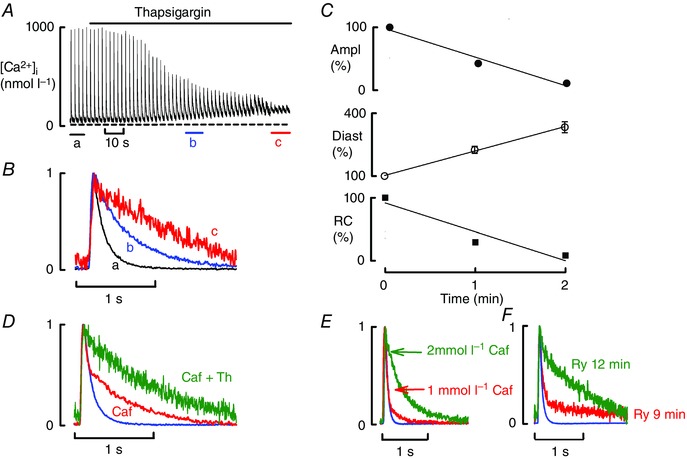
All data obtained in the presence of ISO (1 μmol l–1). A, time course. B, specimen, normalised transients from points indicated in A. C, mean data (6 cells, 4 rats) for the time course of change of (from top to bottom): amplitude (Ampl); diastolic Ca (Diast); rate constant (RC) of decay of the Ca transient. D, effects of adding thapsigargin in the presence of caffeine (normalised traces). E, comparison of the effects of 1 and 2 mmol l–1 caffeine (normalised traces). F, effects of prolonged application of ryanodine (normalised traces) showing control (ISO) and after 9 and 12 min application of ryanodine.