
Figure 6. Effects of gradual application of 1 mmol l–1 caffeine .
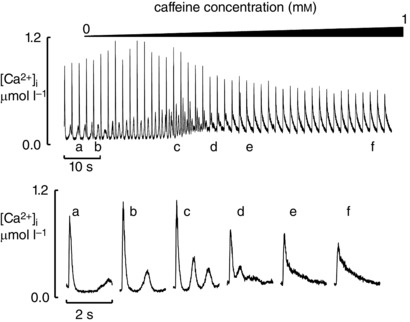
The cell was exposed to ISO (μmol l–1) in an elevated Ca concentration (3 mmol l–1). The top trace shows the time course. Caffeine (1 mmol l–1) was applied with a slow solution change as shown. The lower traces show expanded records obtained at the times indicated above.