
Figure 7. A model for the effects of increased leak and altered SERCA activity on the systolic Ca transient .
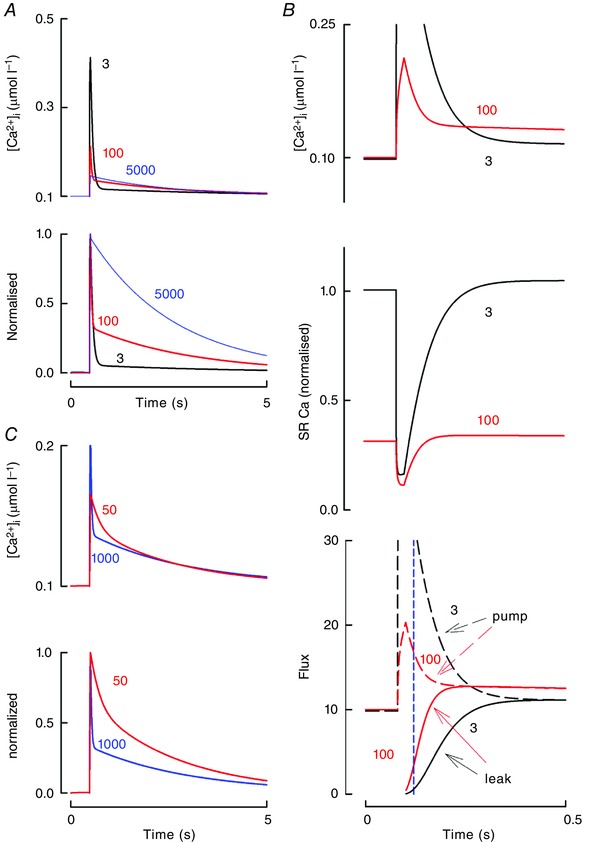
A, the effects of altered leak. Top, calculated transients (right hand is expanded version); bottom, normalised transients. B, Detailed analysis. Panels show (from top to bottom): expanded Ca transients; SR Ca; SR Ca fluxes: solid, SERCA; dashed, RyR leak. For clarity, the large Ca release during the initial phase of the Ca transient has been suppressed. Transients were calculated with the values of leak parameter (l) indicated. Dashed line shows l = 3; solid, l = 100; dotted, l = 5000. The model represents Ca efflux from the SR as l.{([Ca2+]SR)3 – ([Ca2+]i)3}. Ca re‐uptake into the SR is given by k.([Ca2+]i) where k has the value 1000 s−1. Ca efflux across the surface membrane (largely on NCX) is represented as p.([Ca2+]i) where p has a value of 50 s−1. Ca influx into the cell comprises two components: a constant of value 5 μmol l−1 s−1 and another, representing influx on the L‐type Ca current which, for simplicity, delivers 5 μmol l−1 over a 20 ms period. Cytoplasmic buffering is represented by assuming that 1% of calcium is free. The SR volume and Ca buffering are such that a given movement of Ca from cytoplasm to SR changes the free SR Ca by a factor of 10 times that of the cytoplasmic Ca. C, effects of altering SERCA activity. Leak (l) had been increased to a value of 100 in both traces. The dashed line shows SERCA activity (k) at 1000 and this is reduced to 50 at the continuous line.