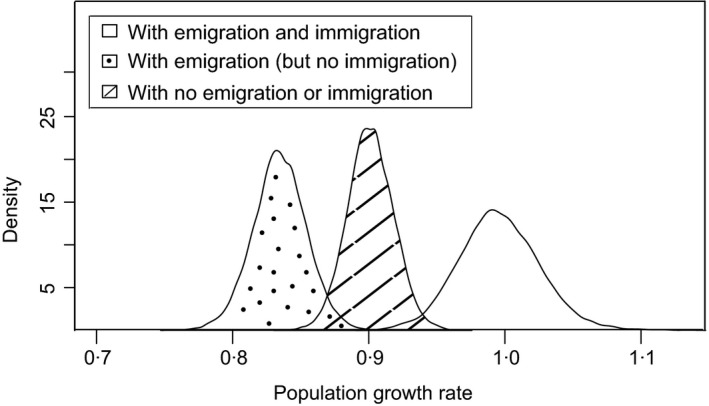
Figure 3.

The projected population growth rate when all demographic rates (i.e. emigration, immigration and survival) were included (white), when emigration but not immigration (dotted) was included, and when neither emigration nor immigration (hashed) was included for the Greenland white‐fronted goose subpopulation at Wexford, 1983–2010. Population persistence requires population growth rates near one (i.e. the white distribution). This fig. confirms Wexford is functionally a large sink, where annual immigration is necessary for observed population stability.
