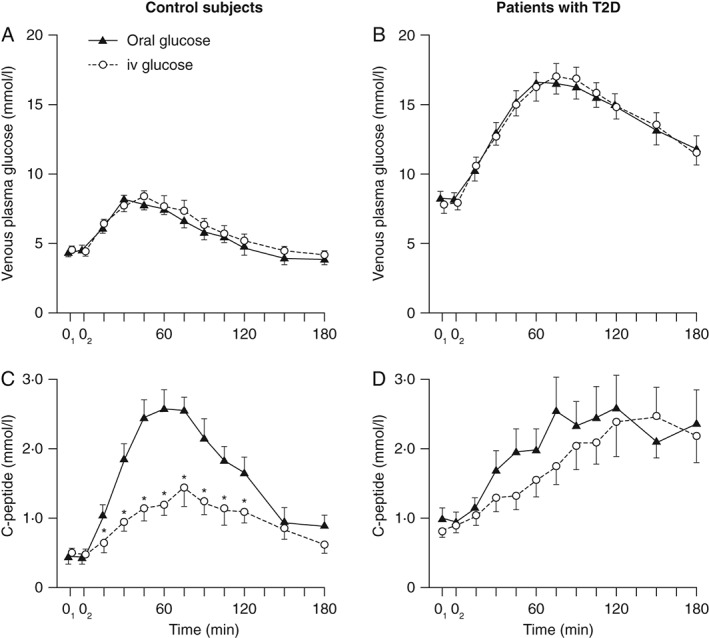
Figure 1.

The incretin effect in control subjects and patients with type 2 diabetes (T2D). Venous plasma glucose and integrated incremental β‐cell secretory responses to oral glucose loads (black triangles) or ‘isoglycaemic’ intravenous glucose infusion (open circles). After an overnight fast, oral glucose (50 g glucose/400 ml) was ingested (time 0) and blood samples taken every 15–120 min and then every 30 min for the final two samples. Isoglycaemic intravenous glucose infusions were designed to mimic glucose concentration profiles after glucose ingestion. Asterisks denote significance (p < 0.05) to the respective value after oral load. © Springer‐Verlag 1986, reproduced with permission from Nauck et al. Diabetologia 1986; 29: 46–52 5. iv, intravenous.
