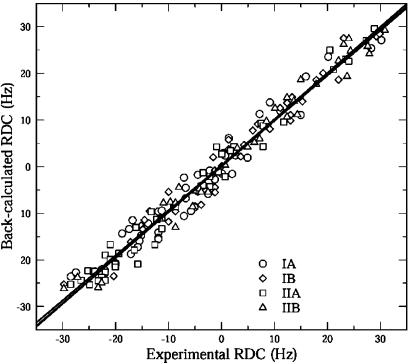
Fig. 3.
Correlation between the experimentally measured (Fig. 2) HN-N dipolar couplings versus the back-calculated values on the basis of crystal structure (PDB ID code 3HSC) for all four subdomains of Hsc70 NBD. The lines represent the least-squares fits for the individual sub domains: IA, Y = 0.158 + 0.964X; IB, Y = 0.365 + 0.966X; IIA, Y = 0.256 + 0.989X; and IIB, Y = 0.035 + 0.979X.

