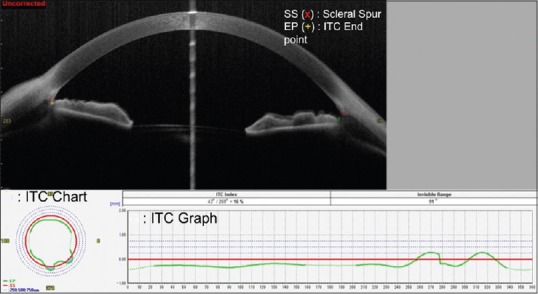
Figure 8.

Illustration of the evaluation of Iridotrabecular contact (ITC) on CASIA. (a) Single frame cross-sectional image with the scleral spur (SS) and iris-trabecular contact end-point (EP) marked by an observer grading the image. (b) The ITC chart with the blue area illustrating the amount and distribution of ITC. (c) The ITC graph with the green line above the red line (representing the SS) depicting the amount of angle closure, measured as the ITC index
