Fig. 5.

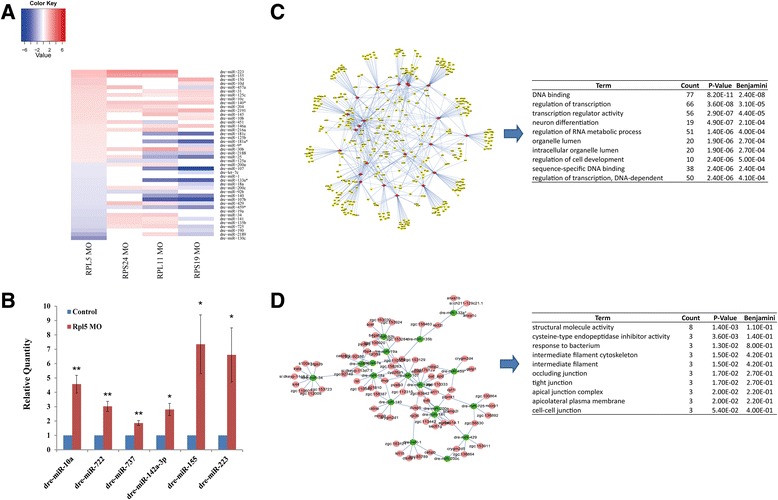
Differential expressed miRNAs and their potential targets in RPL5-deficient zebrafish embryos. a The heatmap shows expression pattern of miRNAs, which were significantly regulated with fold-change > 1.5 and p-value < 0.05 in RPL5 MO, in all DBA zebrafish models. The red module represents the up-regulated miRNA and the blue module represents the down-regulated miRNA. b Representative experimental validation of the regulated miRNAs by Real-time PCR analysis. miRNAs expression was represented as mean ± SD and Two-way ANOVA was performed for comparison between Control and RPL5-deficient zebrafish embryos (**P < 0.001, *P < 0.01, n = 3). miRNAs expression in Control samples was normalized to 1. c-d Overview of the regulatory networks containing differentially expressed miRNAs and their candidate mRNA targets in RPL5-deficient zebrafish embryos. Red/green nodes denote up/down-regulated miRNAs, and pink/yellow nodes denote their potential up/down-regulated mRNA targets. Edges denote the regulatory relationships between miRNAs and their predicted mRNA targets
