
Fig. 5.
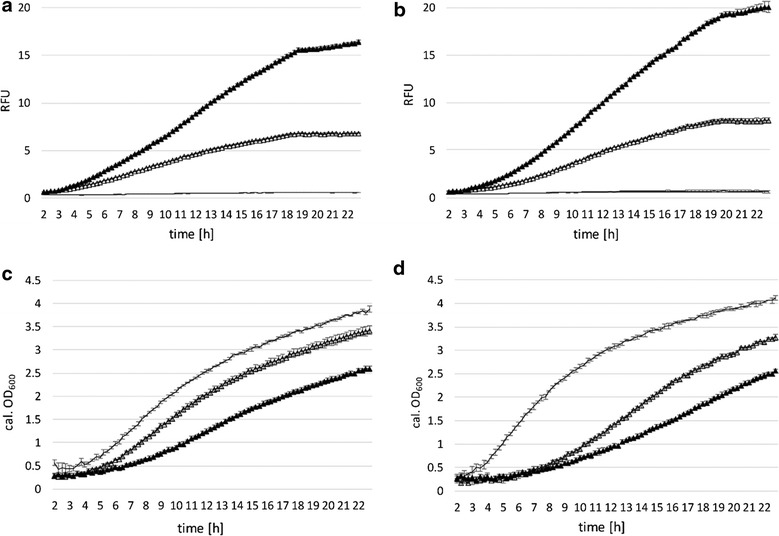
Promoter characteristics of PlacSynth and growth behavior. a, c MRS medium with glucose and 5 μg ml−1 CM; b, d MRS medium with galactose and 5 μg ml−1 CM, mean values of four replicates are given and standard deviations are indicated. Filled triangle induced; triangle non-induced. a, b specific expression levels of mCherry under control of PlacSynth after induction with 1 mM IPTG (or no induction) after 2 h in BioLector® micro-fermentation. Change of mCherry expression (RFUs, relative fluorescent units) over time (hours) of PlacSynth mediated expression in comparison to the negative control is shown (solid line). c, d calculated OD600 values. Solid line negative control