
Fig. 7.
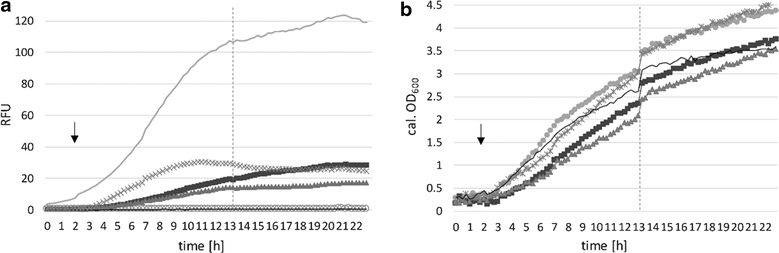
Expression and growth comparison of inducible promoters to constitutive promoter. BioLector® micro-fermentation measurement for 23 h in selective MRS medium with glucose with low pH FlowerPlate at 30 °C (individual values). Dotted vertical line indicates sampling point (200 µl) for semi-quantitative Western blot, 13 h after start, followed by ongoing measurement, therefore OD600 curves are shifted after sampling. Arrow indicates induction time point (or absence of inducer). Solid line mCherry under control of constitutive P11 promoter (pCDLbu1ΔEc_P11_mCherry), –x-: T7 RNA polymerase based dual plasmid system induced with 1 mM IPTG, square PxylA induced with 2 % xylose, triangle PlacSynth induced with 1 mM IPTG, circle PlacA induced with 2 % lactose. a specific expression levels of mCherry under control of inducible promoters with respective inducers. b corresponding calculated OD600 values