
Fig. 8.
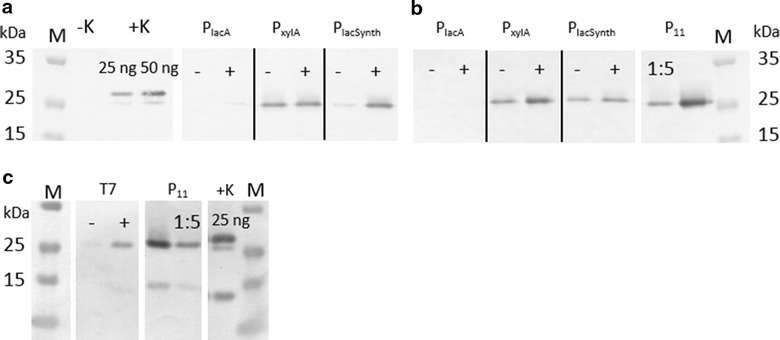
Semi-quantitative Western blot analysis. Evaluation of intracellular mCherry (26.7 kDa) expression after 13 h of BioLecture® micro-fermentation measurement with low pH FlowerPlate at 30 °C. Five µg biomass per slot were applied. a MRS medium with glucose and 5 μg ml−1 CM; b MRS medium with galactose and 5 μg ml−1 CM; c T7 RNAP dual plasmid system, MRS medium with glucose and 5 μg ml−1 CM and 5 μg ml−1 Ery. − non-induced, + induced with the respective inducer. P11 sample (mCherry under control of constitutive P11 promoter) is additionally diluted 1:5 to adjust to expression levels of inducible promoters (in accordance BioLecture® results). M pre-stained protein ladder; +K positive control mCherry(His6) 28.8 kDa; −K L. plantarum 3NSH wild type