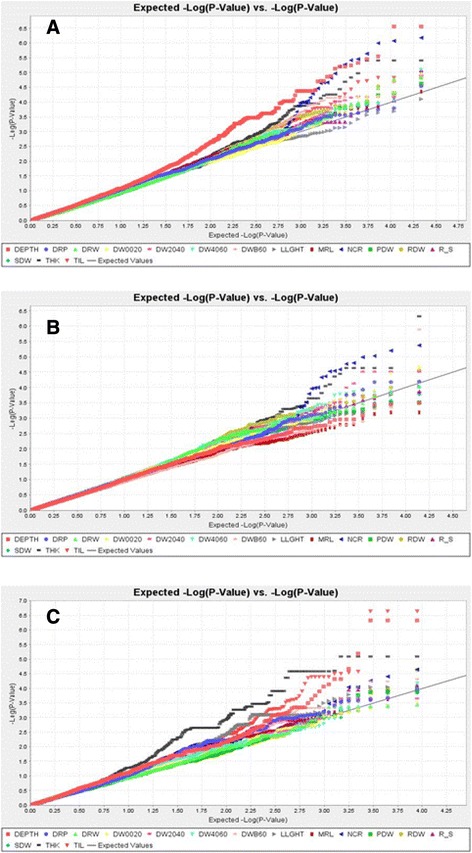
Fig. 4.

Quantile-quantile plots for the whole panel (a), the indica (b) and the japonica (c) subpopulations. The different traits are represented by different colors. The black diagonal represents the uniform law. LLGTH = longest leaf length; TIL = number of tillers; SDW = shoot dry weight; DEPTH = deepest point reached by roots; MRL = maximum root length; NCR = number of crown roots; NR_T = number of crown root per tiller; THK = root thickness; DW0020 = root mass in the 00–20 cm segment; DW2040 = root mass in the 20–40 cm segment; DW4060 = root mass in the 40–60 cm segment; DWB60 = root mass below 60 cm; DRW = deep root mass (<40 cm) weight; RDW = root dry weight; PDW = plant dry weight, SRP = shallow root proportion (0–20 cm); DRP = deep root proportion (<40 cm); R_S = root to shoot ratio
