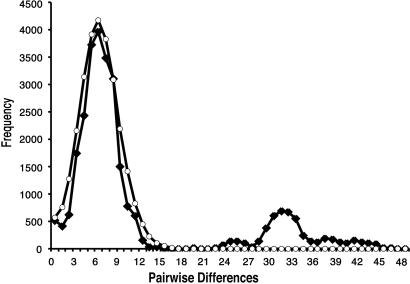
Fig. 3.
Mismatch distribution of pairwise comparisons of all haplotypes. Expected frequencies of pairwise differences between haplotypes under a step-wise expansion model are indicated by ○. Observed frequencies of pairwise differences between haplotypes are indicated by ♦. Modes indicate that most haplotypes coalesce to a narrow time interval that represents the time of expansion. The first mode is generated by comparisons of haplotypes from the western clade (mean 0.62% divergence). The second mode is generated by comparison of haplotypes from the multiple divergent clades (mean 3.2% divergence). Thus, the expansion of the western clade is restricted to a recent time interval on the order of tens of thousands of years, and the divergence of the western and eastern clades is also restricted to a narrow time interval on the order of 200,000 years.

