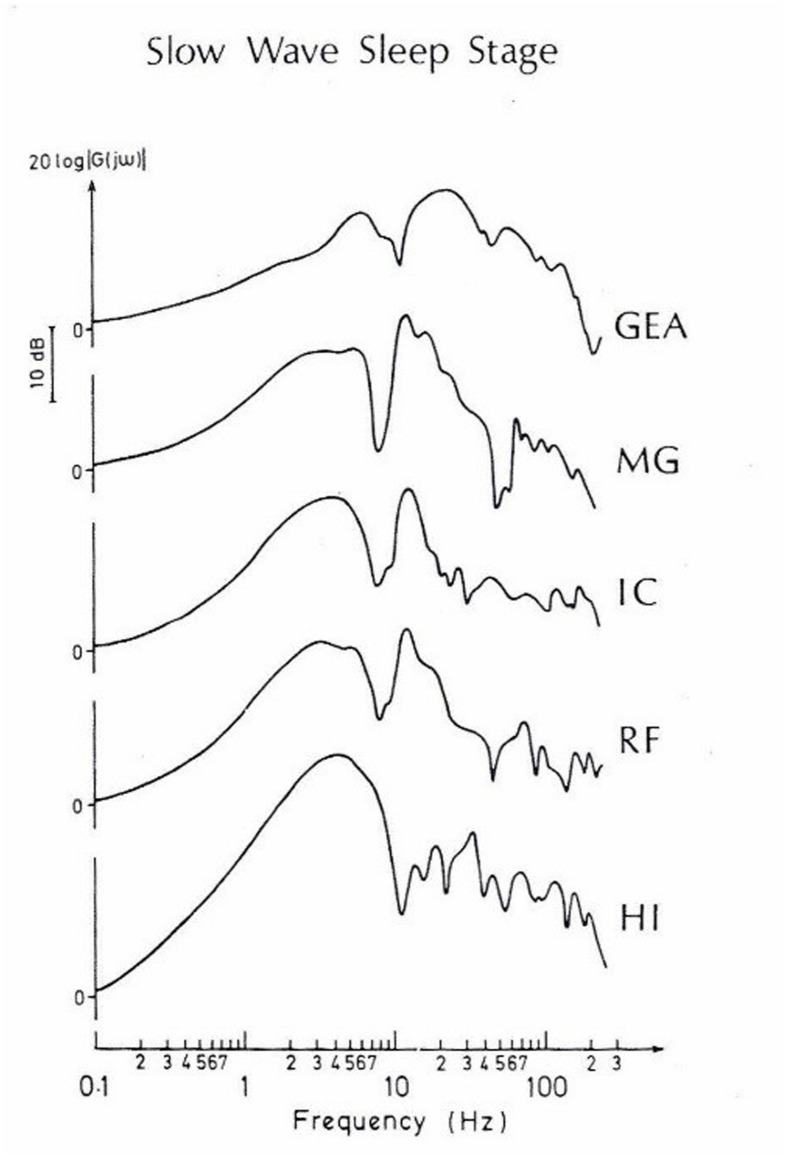
FIGURE 11.
A typical set of amplitude-frequency characteristics obtained by means of the frequency response analyze method and using the selectively averaged evoked potentials (SAEPs), which were simultaneously recorded from different brain nuclei of the cat during the slow-wave sleep stage. Direct computer plottings. Along the abscissa is the input frequency in logarithmic scale, along the ordinate is the potential amplitude, | G(jω)|, in decibels. The curves are normalized in such a way that the amplitude at 0 Hz is equal to 1 (or 20 log 1 = 0). (Modified from Başar et al., 1979).

