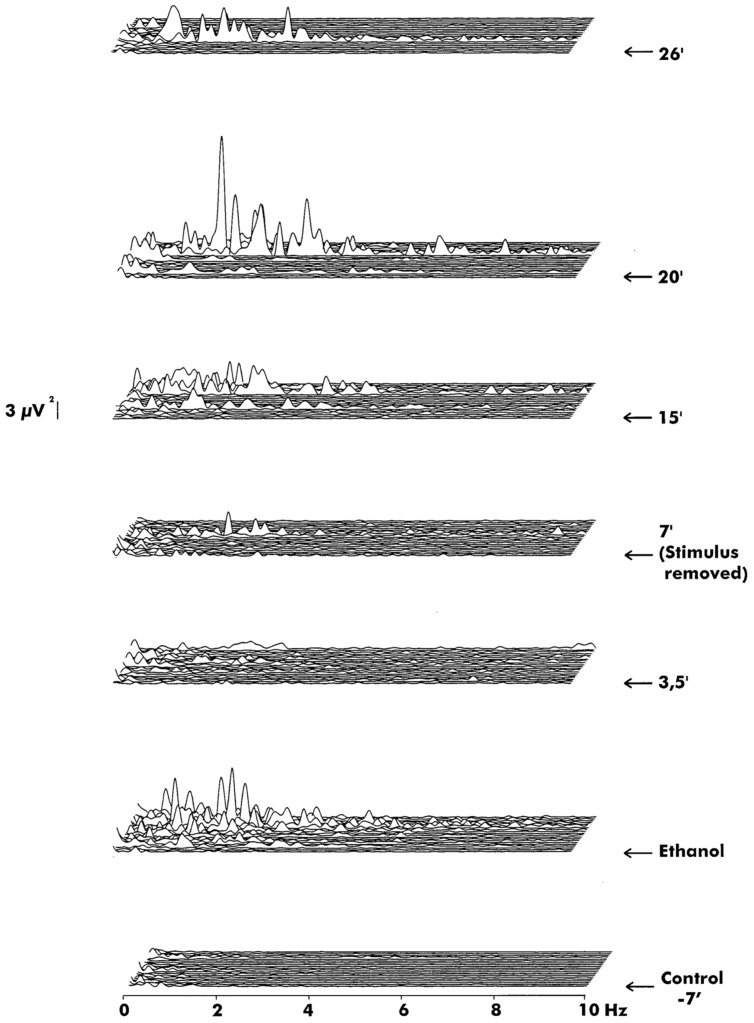
FIGURE 7.
The power spectra of recordings from the corresponding experiment. Each panel consists of 20 single epochs (204.8 s). From bottom: control (prestimulus), immediately after application of ethanol and the following recordings at different times. The stimulus was removed at 7 min after stimulus onset. Note that fluctuation with multiple frequency components reaching well into 10 Hz and beyond was induced shortly after ethanol, most strongly in the 0.5–5 Hz range (panel 2). Then it subsided to occasional small bursts (panels 3 and 4). Firing continued intermittently even after removal of stimulus (panels 5–7).

