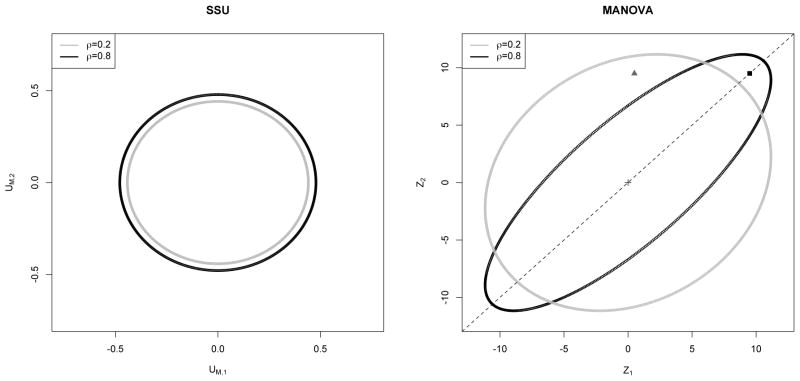
Figure 1.
Comparison of theoretical 95% acceptance regions of SSU test and of MANOVA for K = 2 traits and ρ = 0.2, 0.8 (Compound Symmetry correlation). The area within the gray (black) ellipse is the acceptance region when ρ = 0.2 (0.8). Details of these plots are provided in Appendix S2. SSU’s acceptance region is drawn using the marginal scores UM,1 and UM,2. MANOVA’s acceptance region is drawn based on the test Z′I(0)Z, where I(0) is Fisher Information matrix under H0 : β = 0. The black dotted line is the 1 vector and coincides with the major axes of the ellipses. When β1 = β2, we expect Z1 = Z2. The solid black square represents a situation where β1 = β2 ≫ 0. When β1 & β2 are significantly apart, we expect the same for Z1 & Z2, and such a situation in represented by the gray triangle.

