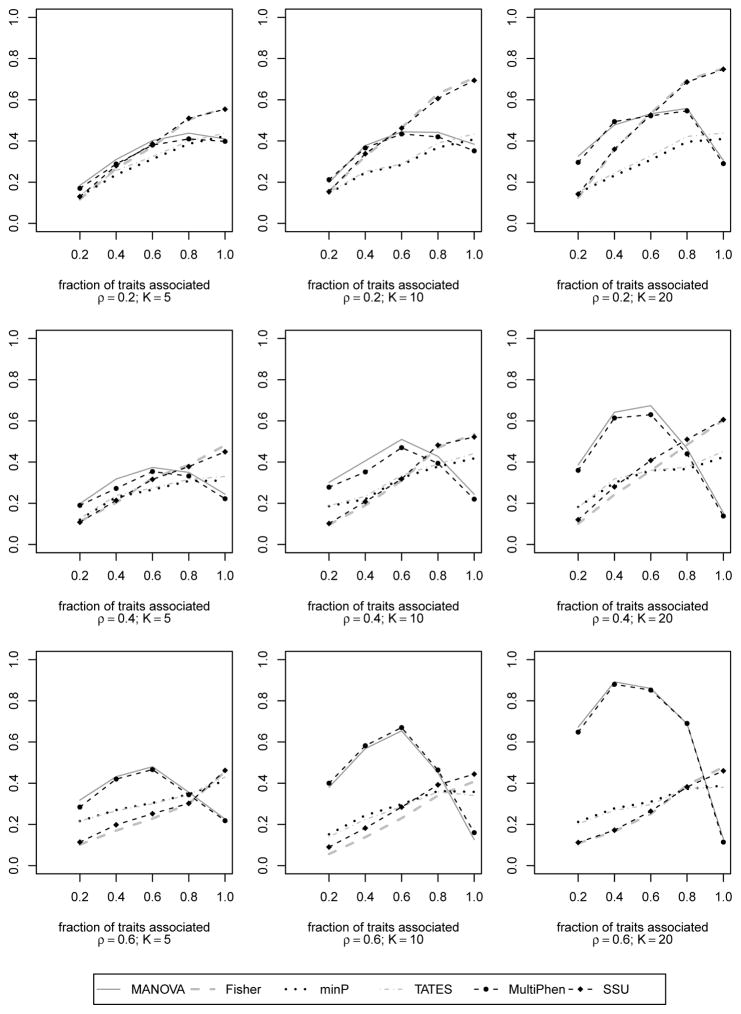
Figure 3.
Empirical power curves of the different existing association tests for K = 5, 10, 20 traits and different within trait correlation values ρ = 0.2, …, 0.6 based on N = 500 datasets with n = 400 unrelated subjects. Same effect size of 0.395 (proportion of variance explained is 0.5%) is used for all the associated traits. The power is plotted along y-axis while the fraction of traits associated with the genetic variant is plotted along x-axis.

