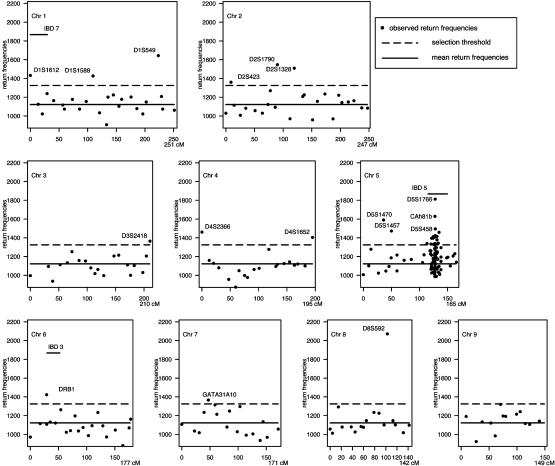
Fig. 3.
BHTA return frequencies: chromosomes (Chr) 1–9 aggregated return frequencies from BHTA screens are plotted vs. marker locations on the genome. Only markers included in the screening are shown. The median return (1,122) is marked by a horizontal solid line, whereas the selection threshold (1,325) is marked by a broken line. A total of 48 markers with return frequencies above the threshold are selected and labeled with their names for reference (except for the IBD5 region). Discussion on the selection threshold is presented in Implementation of BHTA on IBD Data. Seven horizontal bars indicate the previously reported IBD-susceptibility loci, IBD1–IBD7. All except IBD6 are included in the selection.

