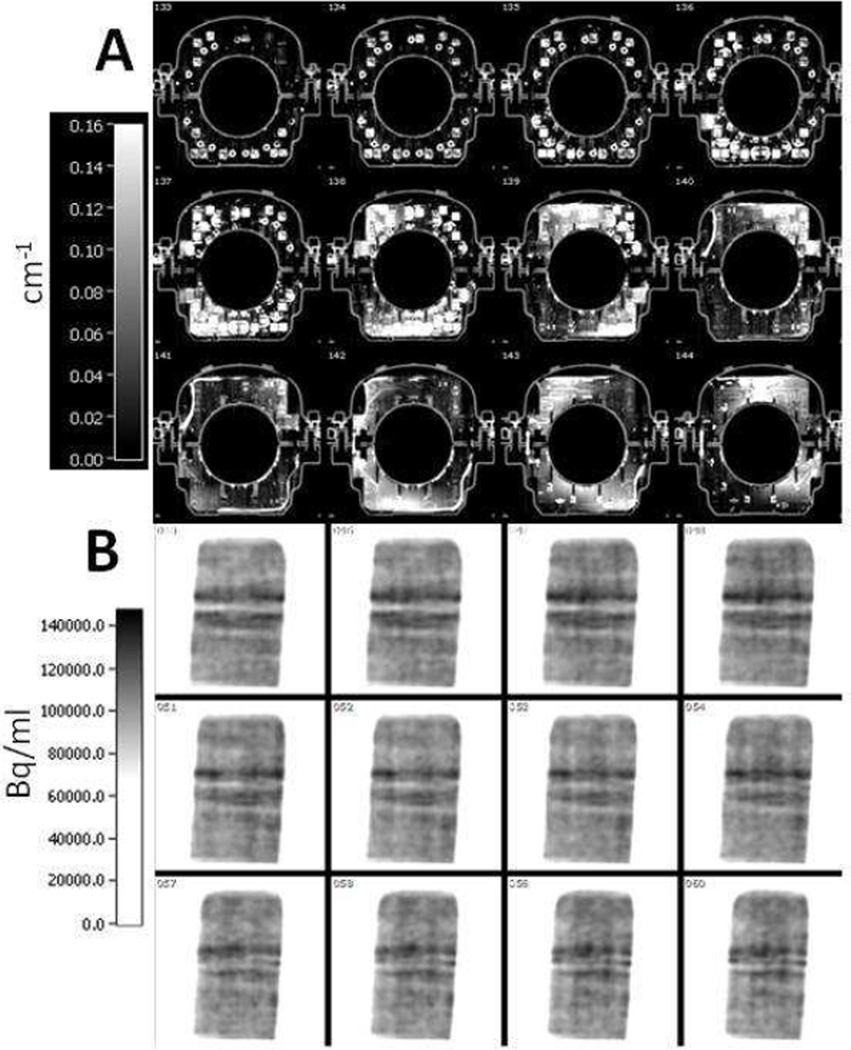
Figure 5.
(A): Sample axial planes of a CT-based attenuation map of a knee coil. High attenuation coefficients and metal artifacts can be seen.
(B): Sample coronal planes from the PET image volume reconstructed with the attenuation map shown in the top panel. Attenuation correction induces image artifacts and quantitative error as can be seen in the image.

