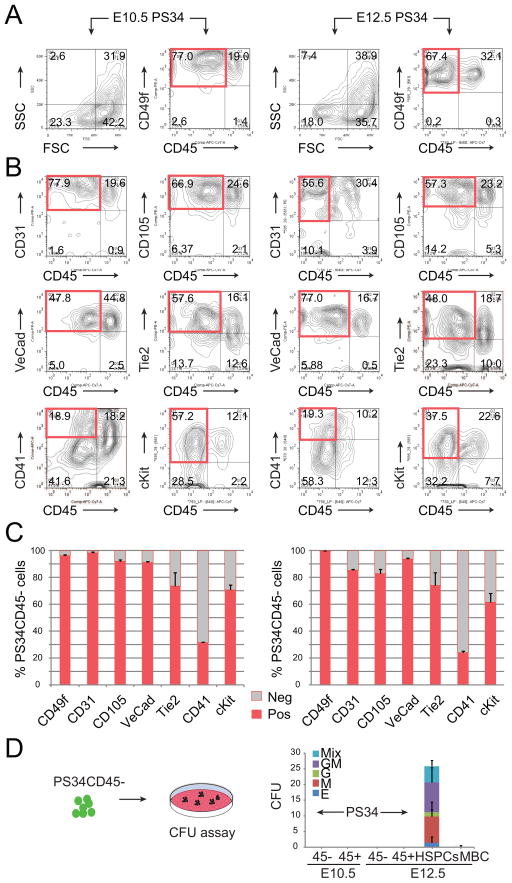
Figure 2. PS34CD45− Cells Express Endothelial and Hematopoietic Markers.
E10.5 (left panels) and E12.5 (right panels) placentas were dissociated to a single cell suspension and analyzed. Prom1+Sca1+CD34+ cells are displayed for (A) FCS/SSC, CD49f and (B) CD31, CD105, VE-Cadherin, Tie2, CD41 and cKit expression. Red boxes highlight the phenotype Prom1+Sca1+CD45− cells.
(C) Quantification of the percentage of PS34CD45− cells positive for CD49f, CD31, CD105, VE-Cadherin, Tie2, CD41 and cKit (mean ± SD, n=2). See also Figure S1.
(D) PS34CD45− and PS34CD45+ cells were isolated from placentas at E10.5 and E12.5 and assayed for hematopoietic colony formation. HSPCs (CD45+ckit+CD34+) and mature blood cells (CD45+cKit−CD34−) were included as controls. Color code represents the type of hematopoietic colony (mean ± SD, n=2). See also Table S1.

