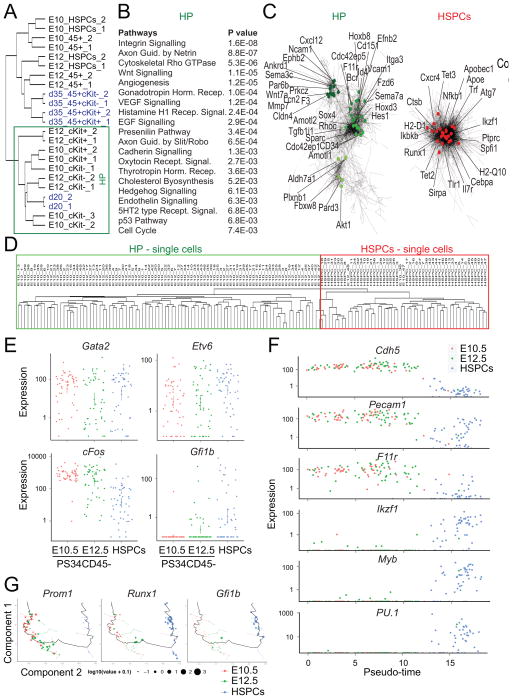
Figure 5. Hemogenic Gene Expression Signature Defined by Integration of Placental Hemogenic Cells and Induced Hemogenic Cells.
(A) Hierarchical clustering showing the integration of gene-expression data from programmed cells [blue, data from (Pereira et al., 2013)] with placental HPs and HSPCs. HP cell clustering is highlighted.
(B) Pathway enrichment analysis was performed on genes enriched in the HP cluster. Enriched terms and correspondent P values are shown.
(C) Co-expression networks show the HP cell network (left panel) and HSPCs enriched network (right panel). Specific genes of the network are highlighted.
(D) Non-supervised hierarchical clustering showing the integration of genome-wide gene-expression data from placenta-derived single cells. Clustering between PS34CD45− at E10.5 and E12.5 (green) and HSPCs (red) are highlighted.
(E) Expression levels of programming factors in placental single cells. Each dot represent FPKM values for individual cells.
(F) Expression levels of endothelial and hematopoietic genes in placental single cells ordered with Monocle software (Pseudo-time). Each dot represents FPKM values for individual cells.
(G) Cell expression profiles (dots) in a two-dimensional independent component space. Lines connecting points represent edges of the minimum-spanning tree constructed by Monocle. Solid black line shows pseudo-time ordering. See also Figure S3.

