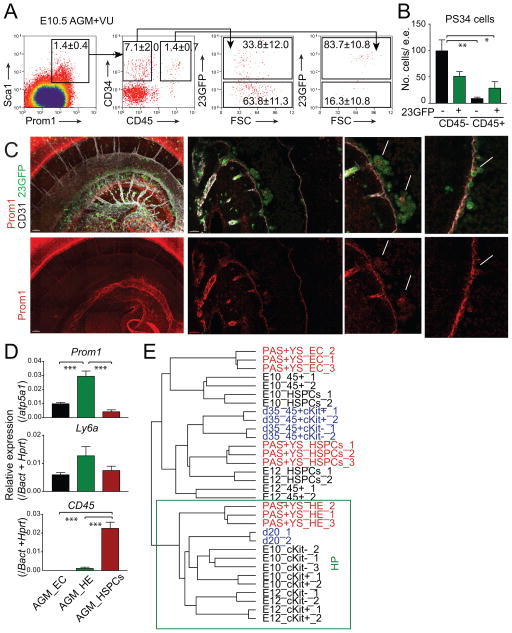
Figure 6. PS34 Cells Are Found in Intra-Embryonic Hemogenic Sites.
(A) E10.5 AGM+VU regions were isolated, dissociated to a single cell suspension and analyzed by flow cytometry. PS34CD45− and PS34CD45+ cells are gated and displayed for the expression of the 23GFP Runx1 reporter. Percentages are shown as mean ± SD, n=3.
(B) Number of PS34 cells per embryo equivalent (e.e.) (mean ± SD, n=3).
(C) Representative whole mount immunofluorescence of an E10.5 (37 somite pairs) 23GFP (green) embryo combined with antibodies against Prom1 (red) and CD31 (white). Left panels show a 3D reconstruction made with 75 confocal images (2.5 μm z-sections); middle and right panels show single-plane z-sections. Arrows highlight Prom1+CD31+23GFP+ cells localized to intra-aortic clusters. Ao, Aorta.
(D) Fluidigm qRT-PCR analysis of Prom1, Ly6a and CD45 in E10.5 AGM+VU endothelial (EC: CD144+(VE-Cadherin)Ter119−CD45−CD41−23GFP−), hemogenic endothelium (HE: CD144+Ter119−CD45−CD41−23GFP+) and HSPCs (CD144+Ter119−CD45−CD41+23GFP+) (mean ± SD, n=3). *p<0.05; **p<0.01, ***p<0.001.
(E) Hierarchical clustering showing the integration of gene-expression data from programmed cells [blue, (Pereira et al., 2013)], E8.5 conceptus (PAS+YS) cells [red, (Swiers et al., 2013)] and placental derived precursors. The box highlights HP cell clustering.

