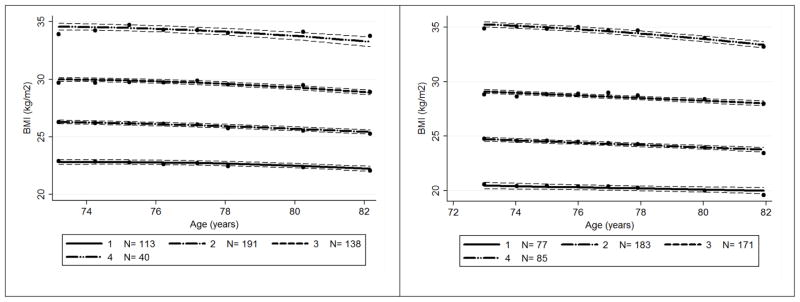
Figure 1.
BMI trajectories among participants from the Health, Aging, and Body Composition study during a 9 year follow-up.
Subheading – left side figure
Men
N=482
Subheading – right side figure
Women
N=516
The lines are the mean values of BMI and the dashed lines represent their 95% confidence intervals.

