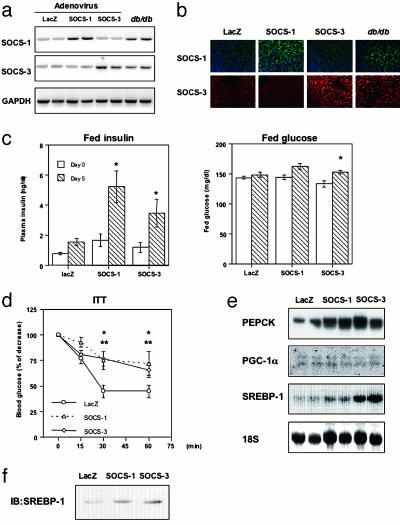
Fig. 1.
Increased SOCS-1 or -3 in liver causes systemic insulin resistance. (a and b) Comparable expressions of SOCS-1 and -3 introduced by adenovirus injection to those in db/db mice. (a) Shown are representative results of RT-PCR using RNA from liver with the indicated treatment. (b) Immunostaining for SOCS-1 (Upper) and SOCS-3 (Lower) in liver. (c) Increased insulin and glucose concentrations caused by overexpression of SOCS-1 or -3 in liver. Each bar represents the mean ± SE (n = 8) of the plasma insulin concentrations (Left) or blood glucose (Right) in random fed state at days 0 and 5 after adenovirus injection. (*, P < 0.05 day 0 vs. 5.) (d) Impaired insulin sensitivity by overexpression of SOCS-1 or -3 estimated by the insulin tolerance test. Results are expressed as mean ± SE (n = 8) of percent of initial glucose level. (*, P < 0.05 LacZ vs. SOCS-1; **, P < 0.05 LacZ vs. SOCS-3 adenovirus treatment.) (e) Amounts of mRNA of phosphoenolpyruvate carboxykinase, PGC-1α, and SREBP-1c in liver treated with SOCS-1 or -3 adenovirus. (f) Increased levels of nuclear SREBP-1 protein in liver overexpressing SOCS proteins. Shown are the representative results of immunoblot analysis with αSREBP-1 using nuclear fractions.

