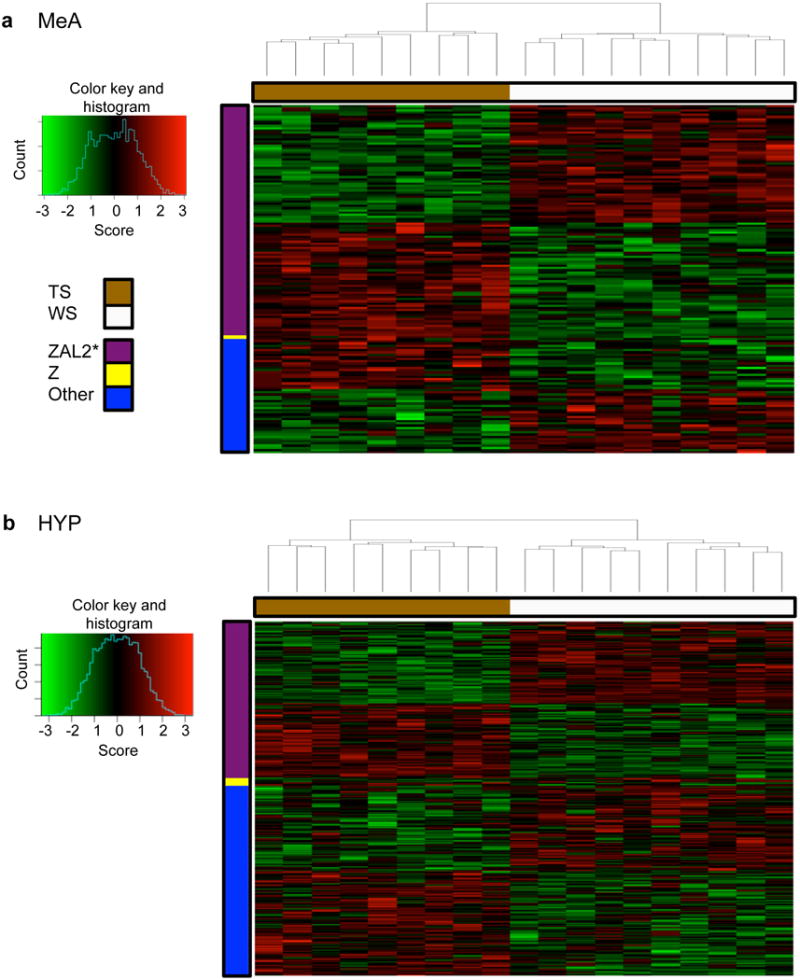
Figure 3.

Heat map of expression for individual genes in the MeA greenyellow (a) and HYP black (b) modules. Columns represent samples, sorted by hierarchical clustering. Morph is indicated by the color bar at the top (tan = TS and white = WS birds). Rows represent genes, sorted by chromosome location, then by hierarchical clustering. The color bar on the left indicates the chromosome location of the genes. Genes were assigned to chromosome 2 (ZAL2, purple), chromosome Z (Z, yellow), or other (all genes not assigned to ZAL2 or Z, blue). Expression (score) is represented by the standardized residual (value-mean/std. deviation). Red, increases; green, decreases; black, no change relative to the mean. *All ZAL2 genes located within these two modules were also located within the inversion.
