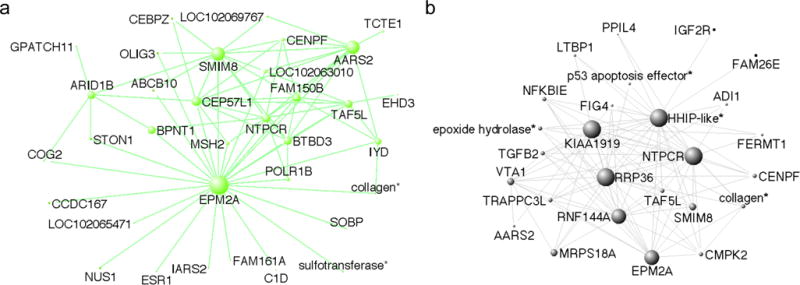
Figure 4.

Connectivity in the (a) MeA greenyellow and (b) HYP black networks. Only the 75 (MeA) or 100 (HYP) strongest connections among the top 50 most well-connected genes (determined using kIN) are shown. Node size represents the degree of connectivity. *Where available, gene description for LOC genes are used. See supplemental tables S2 and S4 for LOC gene designations.
