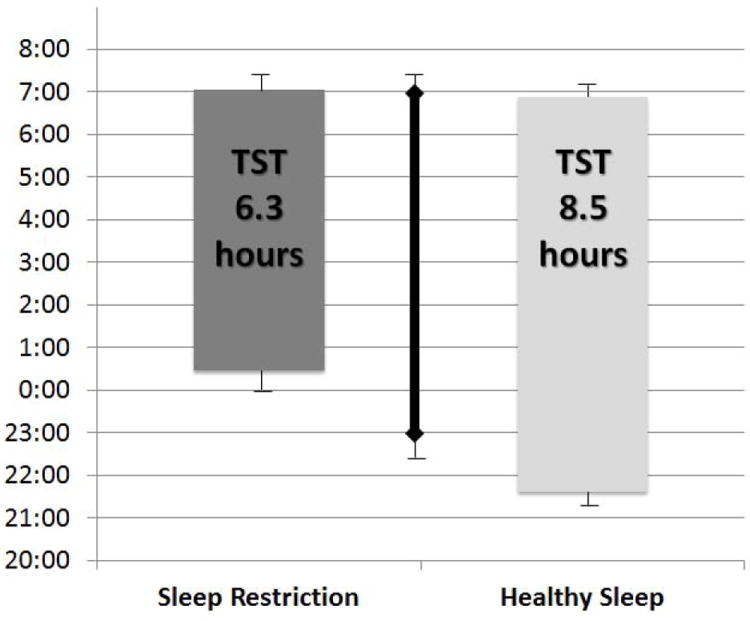
Figure 2.

Sleep schedules and sleep duration for three sleep conditions. Plotted means with SD bars first averaged within subject, then across subject; values are unadjusted and not from model fit. Significant differences in sleep onset were found across all three sleep conditions based on a linear mixed model (p<0.001).
Bottom of each bar reflects actigraphic sleep onset
Top of each bar reflects actigraphic sleep offset/waking
Solid line reflects baseline sleep duration /schedule
Three weeks significantly different, p<.001
