
Figure 3.
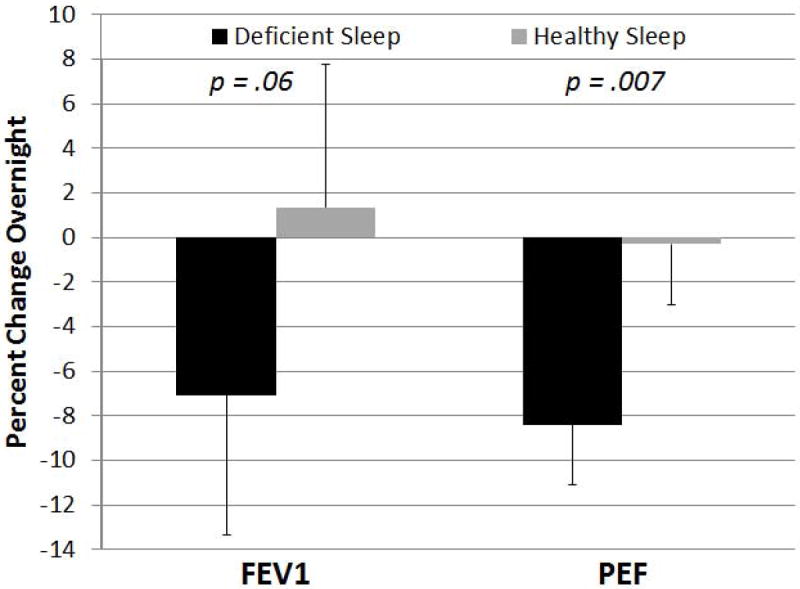
Comparison of overnight change in peak expiratory flow rate (as measured by daily peak flow assessment) for the deficient sleep and healthy sleep opportunities. Plotted values are mean estimates with SE bars obtained from linear mixed model. P-value is comparing deficient sleep to healthy sleep opportunity.