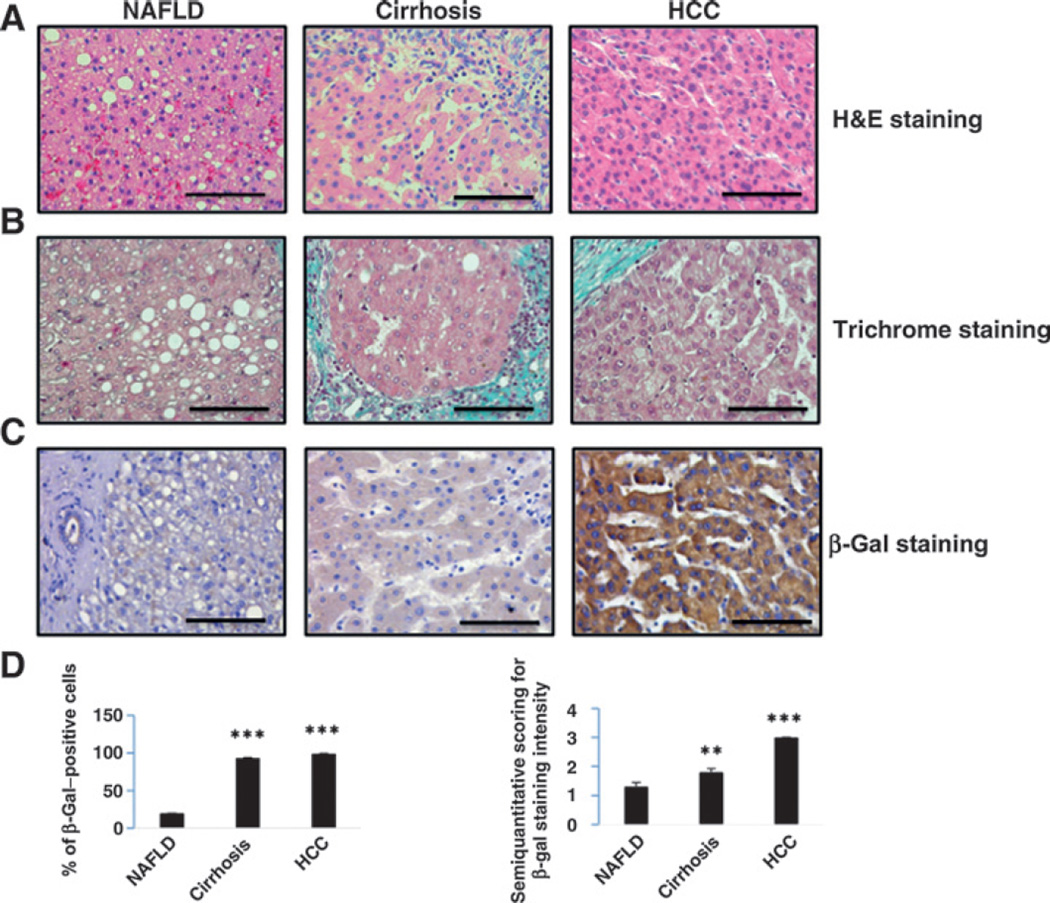
Figure 2.
β-gal expression in the liver of patients with NAFLD, cirrhosis, and HCC. A and B, histologic features of liver biopsies from patients with NAFLD, cirrhosis, and HCC. A, representative pictures of H&E staining. B, representative pictures of trichrome staining. In samples from patients with NAFLD, microvesicular and macrovesicular steatosis are apparent; in samples from patients with cirrhosis, the characteristic regenerative nodule surrounded by scattered lymphocytes and fibrous connective tissue was more visible with trichrome staining. In samples from patients with HCC, proliferation of hepatocytes and, in the top left of the trichrome image, the capsule of the tumor can be observed. C, representative pictures of β-gal immunostaining of human liver samples with NAFLD, cirrhosis, and HCC (n = 10 per condition). All HCC cells were highly positive; positivity of hepatocytes with NAFLD was significantly lower and was intermediate in viral cirrhosis. Bar, 100 µm. D, the percentage of β-gal–positive cells was calculated in 10 blindly chosen HPF at a magnification of ×400 (left). Also, after performing quantitative analysis, the results were expressed in a semiquantitative scale (0, 0%; 1, 1%–33%; 2, 34%–66%; 3, 67%–100%; right). Data were expressed as means ± SE. **, P < 0.01 and ***, P < 0.001.

