Figure 3.
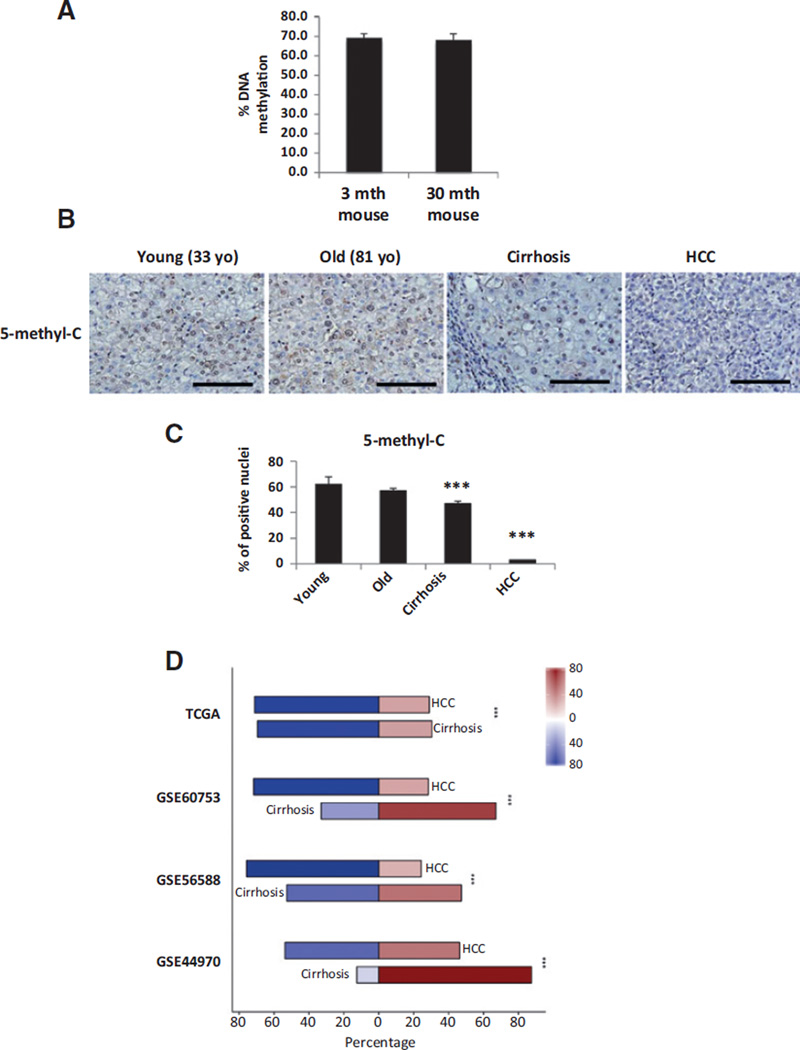
DNA methylation analyses in old versus young mice (A); old and young healthy humans with NAFLD, cirrhosis, and HCC (B and C); and methylation data mining in cirrhotic and HCC patients versus control samples (D). Age is indicated in A and B (mth, months; yo, years old). A, proportion of global DNA methylation analyzed with LUMA assay is expressed as mean ± SE of three animals per age group. B, representative pictures of immunostaining for 5-methylcytosine in human liver samples from a young 33-year-old) versus an old 81-year-old) healthy human subject (n = 6 per condition, 33–48 years old → young range, 72–81 years old→ old range) and in human liver samples with cirrhosis and HCC (n = 10 per condition). C, data are shown as mean ± SE of 10 blindly chosen and evaluated HPF. Bar, 100 µm.***, P < 0.001. D, stacked bar plots showing the proportions of overall methylation of differentially methylated genes between patients with cirrhosis or HCC and healthy patients, taken from four public datasets (GSE44970, GSE56588, GSE60753, and TCGA). Red bars represent hypermethylated genes, whereas blue bars represent hypomethylated genes. Color intensity corresponds to the magnitude of differential methylation. ***, P < 0.001 between the differences in the ratios of hypomethylated genes in cirrhosis and HCC in each dataset.

