Figure 5.
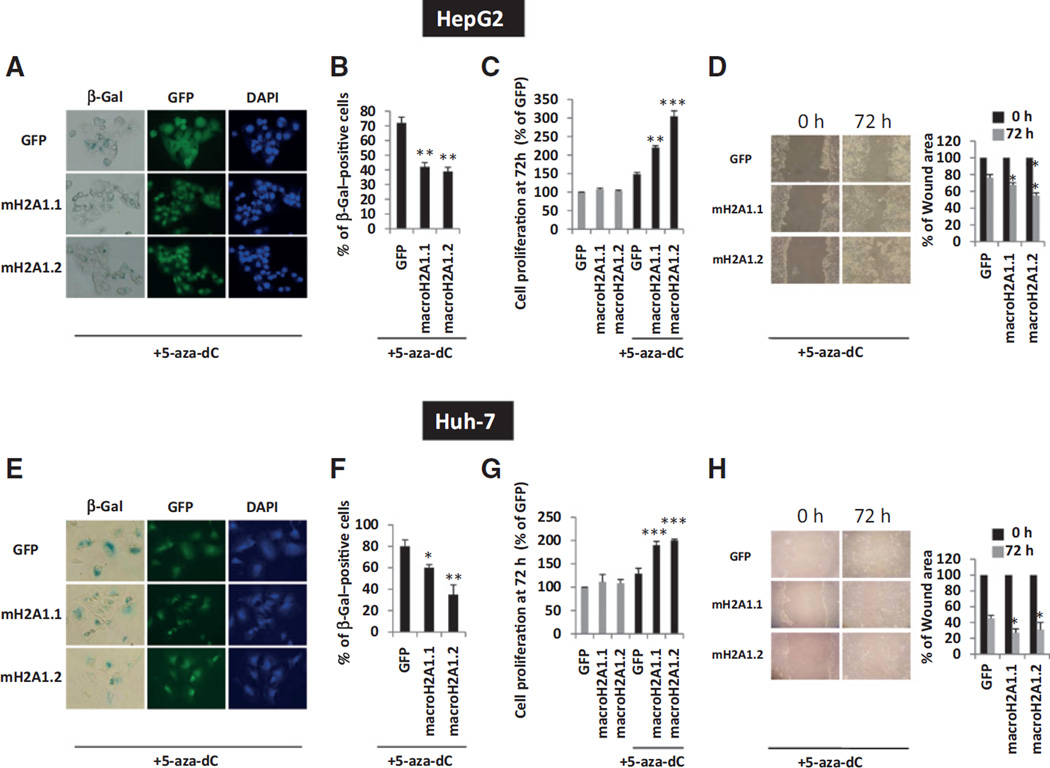
5-aza-dC–induced senescence and growth inhibition in HepG2 (A–D) and Huh-7 cells (E–H) transgenic for GFP, macroH2A1.1-GFP (macroH2A1.1), or macroH2A1.2-GFP (macroH2A1.2) following treatment with 12 µmol/L 5-aza-dC for 72 hours. A and E, β-gal staining of HepG2 (A) and Huh-7 (E) cells. Nuclei were counterstained with DAPI. Images were taken under bright light for β-gal and with respective channels for DAPI (blue) and GFP (green). B and F, positive cells for β-gal staining as in A and E were counted and represented as a proportion of the total. Results are expressed as mean ± SE of three experiments. C and G, MTT assay in HepG2 (C) and Huh-7 (G) cells after 72 hours with (black columns) or without (gray columns) 5-aza-dC incubation; percentage growth compared with untreated GFP control cells. D and H, scratch migration assay in HepG2 (D) and Huh-7 (H) cells. Left, representative images taken at 0 and 72 hours after scratching. Right, software-assisted quantification of wounded areas expressed as a percentage of the initial scratch. All data were expressed as mean ± SE of three independent experiments.*, P < 0.05; **, P < 0.01; and ***, P < 0.001.

