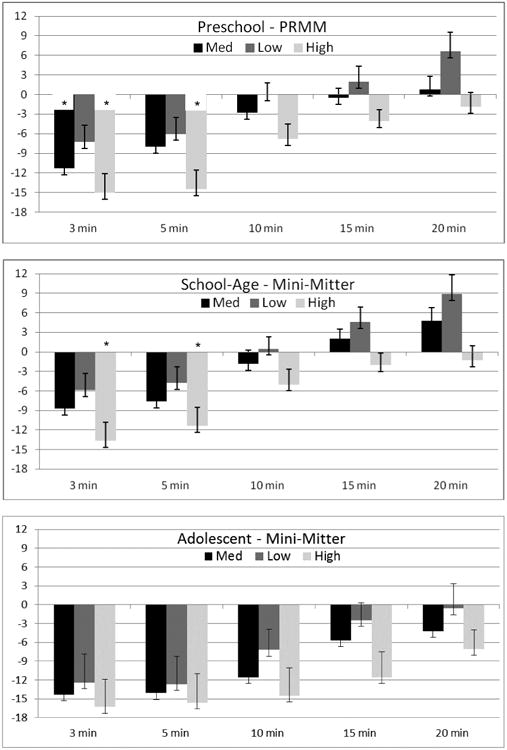
Figure 2.

Difference in sleep onset latency (SOL) between PRMM actigraphy and PSG by age group. PSG is indicated by the zero (0) axis. Positive values indicate overestimation of SOL by actigraphy, and negative values indicate underestimation of SOL by actigraphy. * indicates signficiant post-hoc comparison between actigraphy and PSG (p ≤ .001).
