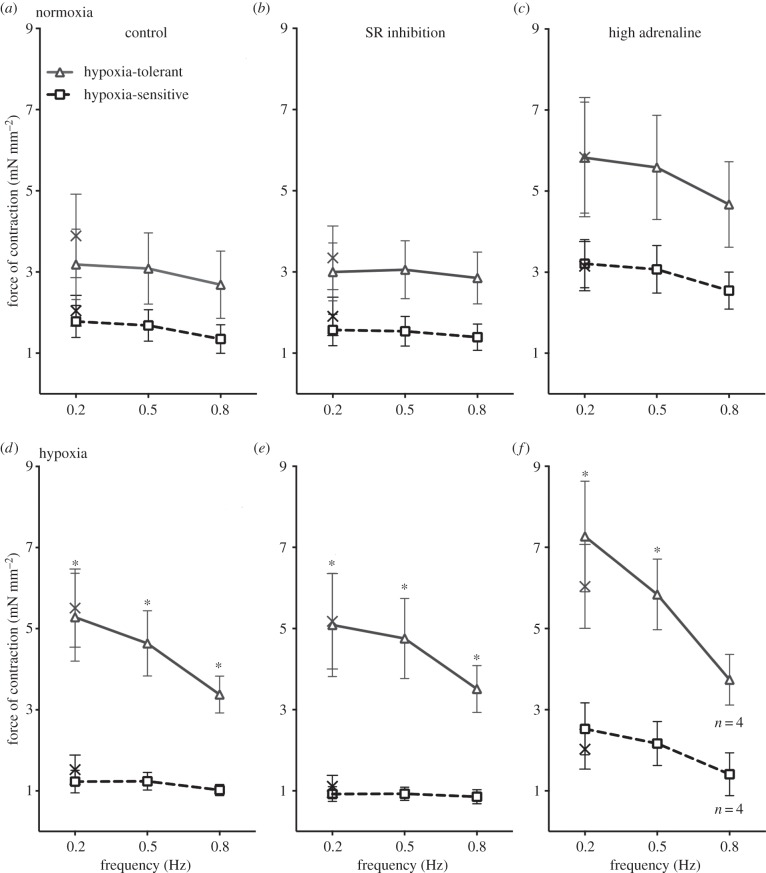
Figure 2.
Myocardial muscle from hypoxia-tolerant fish outperforms that from hypoxia-sensitive fish under acute hypoxic exposure. Figure shows contractile force of cardiac muscle preparations from HCT hypoxia-tolerant fish and hypoxia-sensitive fish under normoxic conditions (a–c) and hypoxic conditions (d–f). (a,d) Myocardial force across physiologically relevant contraction frequencies under control conditions. (b,e) The effect of inhibiting intracellular Ca2+ cycling. (c,f) The effect of increasing extracellular Ca2+ influx with adrenaline (1 µM). The crosses show contractile force contraction upon return to 0.2 Hz after the frequency challenges. Values are means ± s.e.m. of n = 5 preparations. Asterisks denote difference between hypoxia-tolerant and hypoxia-sensitive fish (GLM).

