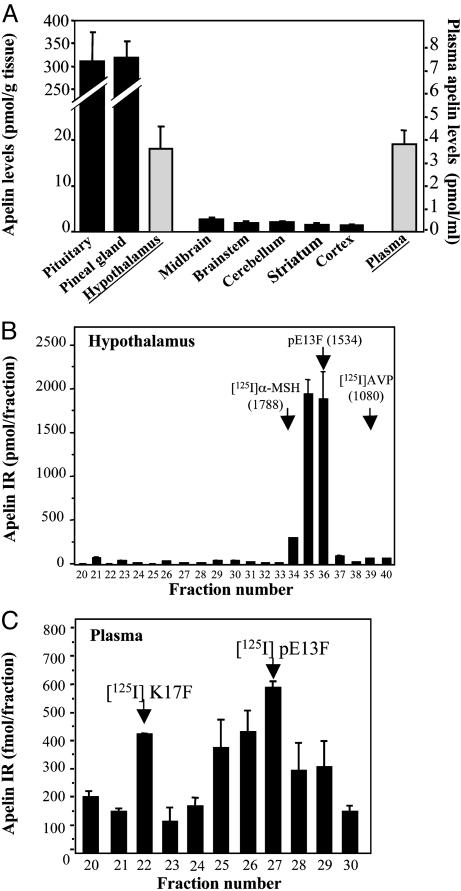
Fig. 1.
Distribution and characterization of apelin-related peptides in rat brain, pituitary gland, pineal gland, and plasma. (A) Apelin IR levels were quantified by RIA. Results are expressed in pmol/g of tissue or pmol/ml of plasma as the mean ± SEM of at least six independent experiments. (B and C) Apelin IR detected in gel permeation chromatography for fractions 20–40 of rat hypothalamic extracts (B) or fractions 20–30 of rat plasma (C). Results are expressed as the mean ± SEM of three independent experiments.

