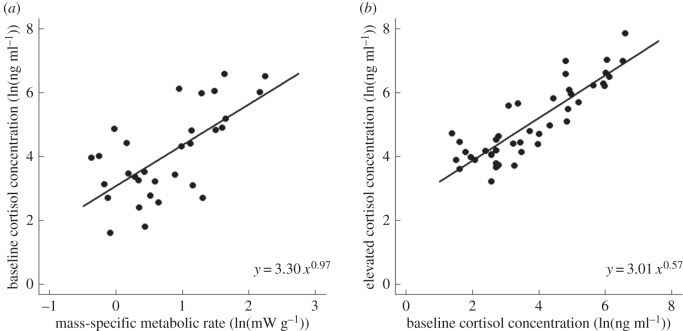
Figure 1.
Relationships in cortisol-dominant mammals (a) between baseline plasma cortisol concentrations (ng ml−1) and resting mass-specific metabolic rate (mW g−1; N = 49) and (b) between elevated plasma cortisol concentrations and baseline cortisol concentrations (N = 43). Data are natural-log transformed.

