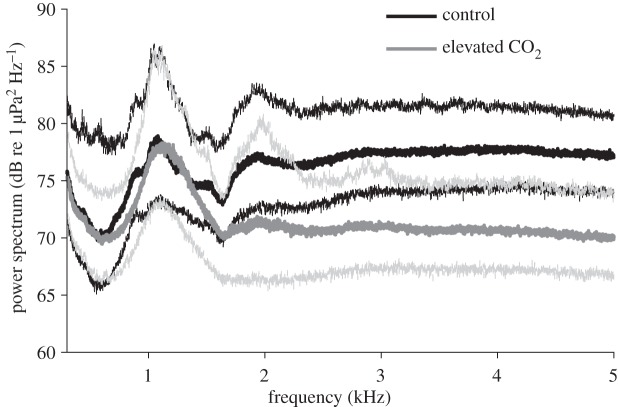
Figure 2.
Acoustic spectra of a current versus a future high-CO2 marine soundscape, based on median (thick lines) ±95% CI (thin lines) acoustic power spectra representing dusk chorus of snapping shrimps (peak frequency approx. 4 kHz) and sea urchins (peak frequency approx. 1.2 kHz) at White Island. Acoustic power was averaged among multiple days of sampling at multiple sites (N = 2 per treatment).

