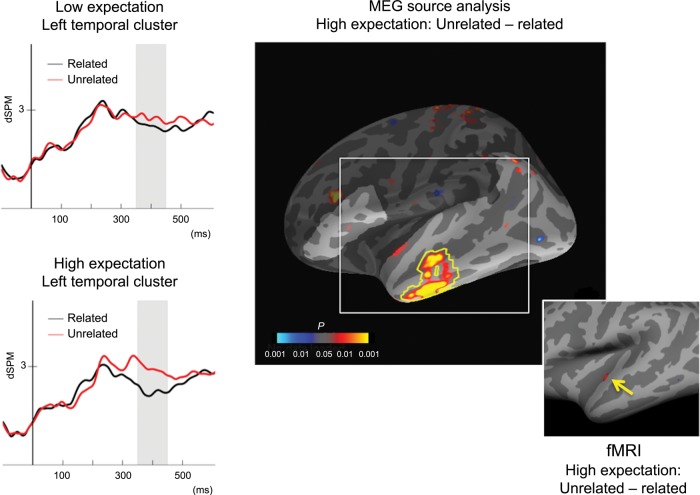
Figure 2.
MEG statistical map illustrating t-values for the unrelated-associated contrast of dSPM source estimates between 350 and 450 ms, thresholded at P < 0.05. Yellow outline indicates the left anterior temporal cluster that demonstrated a significant reduction for the related condition relative to the unrelated condition in the high expectation block. Lighter shading indicates the search region used in the cluster-level permutation test. Inset: cortical fMRI statistical map illustrating left anterior superior temporal region demonstrating a significant reduction for the related condition relative to the unrelated condition in the high expectation block, FDR corrected at P < 0.05. Waveform plots show the mean MEG dSPM activity estimates for the left anterior temporal cluster plotted across the −100:600 ms time-window in each condition, for illustration only.

