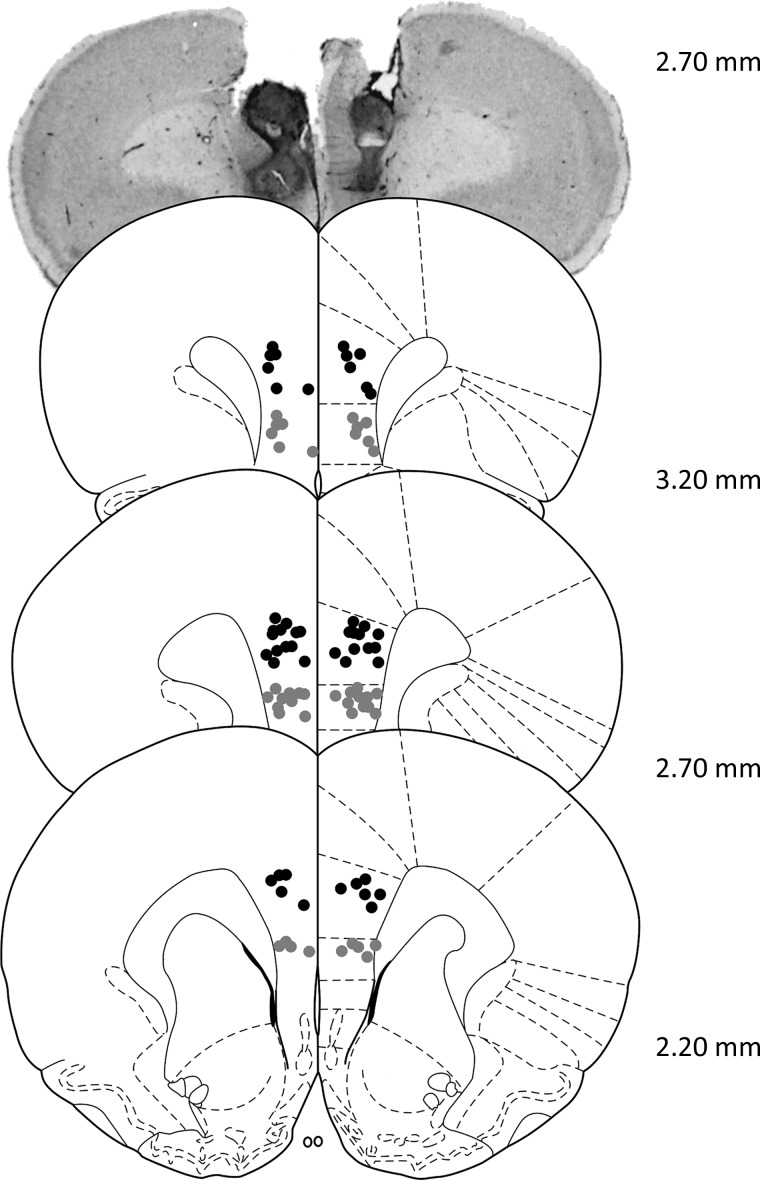
Figure 2.
Histological analysis of cannulae implantation. Location of all acceptable PFC infusions (black dots: PL cortex; gray dots: IL cortex), including a representative photomicrograph. Coordinates are relative to bregma. Plates modified from Paxinos and Watson (1998).

