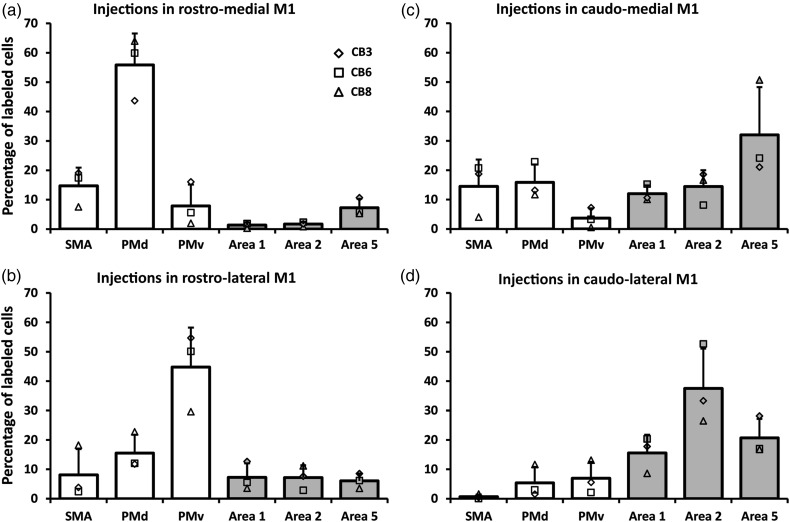
Figure 7.
Proportion of labeled cell bodies in ipsilateral hemisphere. Each panel shows the average proportion of labeled cells in the different premotor and parietal areas (areas 1, 2, and 5) in the reconstructed sections (mean ± SD; n = 3). Data from individual monkeys are shown with different symbols displayed on the top of the bars. (a) Following injections in the RM, most labeled cells were in the premotor areas and we found the greatest number of cells in PMd. (b) Injections in the rostro-lateral (RL) M1 also labeled more cells in the premotor cortex but the area with most labeled cells was PMv. (c) Injections in the CM labeled more cells in area 5. However, the proportion of cells in other areas was more evenly distributed. (d) Finally, injections in the CL labeled more cells in area 2, followed by area 5.

