Figure 2.
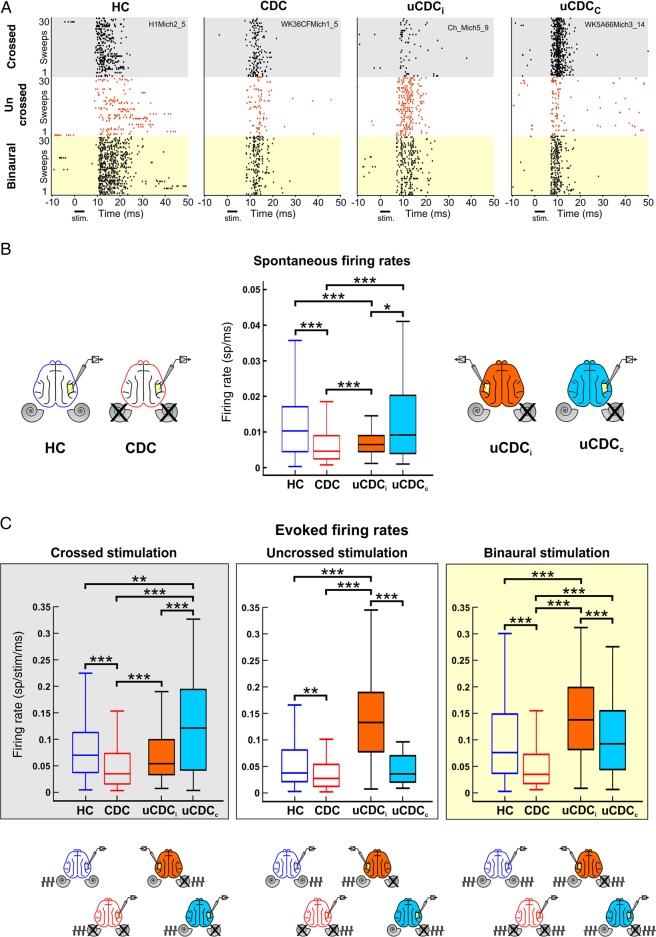
Spontaneous and evoked firing rate analysis. (A) Raster plots of cortical responses to 30 repetitions of crossed (gray boxes), uncrossed (white boxes), and bilateral stimulation (light yellow boxes). Each dot represents an action potential. Responses were stronger for crossed than uncrossed stimulation in all conditions except uCDCi (unilateral animals, hemisphere ipsilateral to the hearing ear) where a stronger uncrossed response was observed. (B) Spontaneous firing rate computed from all recording sites in binaurally normal-hearing and deaf animals (empty boxes) and unilateral deaf animals (filled boxes). The boxes cover the second and third quartiles of the distribution; the intersection line inside the box shows the median and the whiskers the range of the data. The drawings adjacent to the box plots illustrate the relation between recording hemisphere and the cochlea in deaf animals (crossed). Spontaneous firing rate was reduced in binaurally deaf cats and in the ipsilateral cortex of unilateral animals (uCDCi). No difference between hearing control and contralateral cortex of unilateral animal was observed (uCDCc). (C) Box plots of evoked firing rates for all groups and stimulus conditions. The stimulus, recording sides, and groups are depicted below the box plots. Firing rates were analyzed within a response window of 50 ms and calculated for 1 ms. Evoked firing rates for all stimulus conditions were lowest in CDCs, while highest rates were found in the contralateral cortex of the unilateral animal (uCDCc) with crossed stimulation. In the ipsilateral cortex of the unilateral animal (uCDCi), both uncrossed and binaural stimulation evoked the highest firing rates of all groups. Two-tailed Wilcoxon–Mann–Whitney test, *P < 0.05; **P < 0.01; ***P < 0.001.

