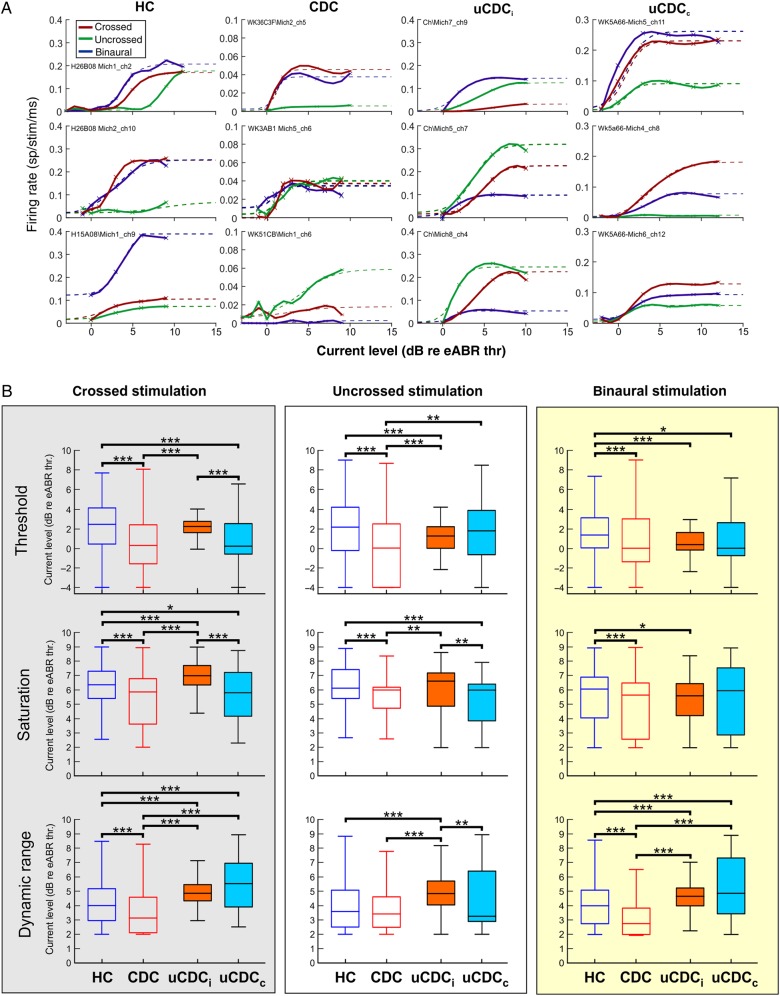
Figure 3.
Basic unit response properties. (A) Rate-level functions for all groups and stimulus conditions (red = crossed, green = uncrossed, and blue = binaural stimulation). Broken lines indicate the sigmoid function fitted to the response curve. For each group, 3 examples of rate-level functions are shown to demonstrate the variability of responses. (B) Quantitative analysis of threshold (first row), saturation (second row), and DR (lower row) calculated from fitted rate-level functions for all groups and stimulus conditions (same scheme as in Fig. 2C). CDCs show the lowest stimulation thresholds and smallest DRs among all groups and for all stimulus conditions (two-tailed Wilcoxon–Mann–Whitney test *P < 0.05, **P < 0.01, ***P < 0.001).

