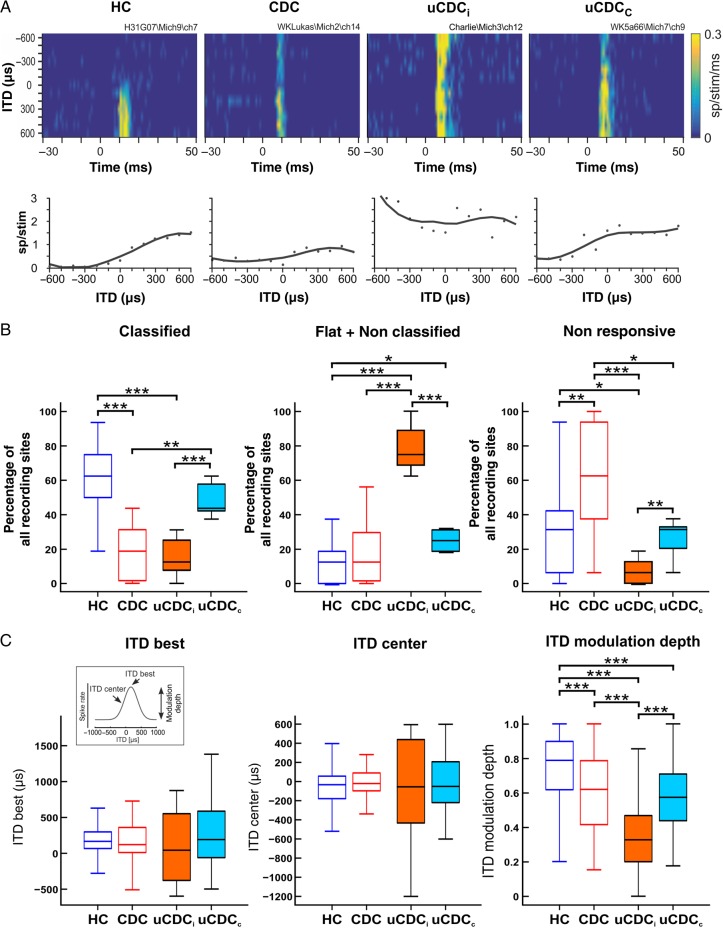
Figure 6.
ITD sensitivity (stimuli presented at interaural level difference of 0 dB). (A) Firing rate (color) as a function of peristimulus time (abscissa) and ITD (ordinate) of 4 typical units showing sensitivity to ITDs (one example per animal group). The lower panels show the number of spikes per stimulus as a function of ITD evaluated from the corresponding color plot. The line fitted along the original data points represents the ITD function showing changes in responsiveness with respect to ITD. (B) Statistical evaluation of ITD sensitivity, presented for all animal groups. Classified units (left) represent those units that systematically changed the firing rate with ITD, thus representing the true ITD-sensitive units (cf. Tillein et al. 2010). The majority of such units were observed in normal-hearing animals (HCs) and in the contralateral hemisphere of the unilateral animals (uCDCc), with only a few in the hemisphere ipsilateral to the hearing ear (uCDCi), and in the binaurally deaf animals (CDC). Correspondingly, nonclassified units and flat units (middle, responding with similar firing rates to different ITDs) were more frequent in the hemisphere ipsilateral to the hearing ear (uCDCi). Units nonresponsive to stimulation (right) were most frequently found in binaurally deaf cats (CDCs), while they were very rare in the ipsilateral cortex of unilateral animals (uCDCi). (C) Comparison of the properties of classified units in all animals and conditions. Analyzed ITD parameters are indicated in the inset. Both ITDbest and ITDcenter showed larger spread over the tested ITD range in uCDCs, but no significant differences were found between groups and conditions (left and middle). MDs of ITD function (right), quantifying ITD sensitivity in the classified units, were lowest in the ipsilateral cortex of the unilateral animals. Two-tailed Wilcoxon–Mann–Whitney test, *P < 0.05, **P < 0.01, ***P < 0.001.

