Figure 1.
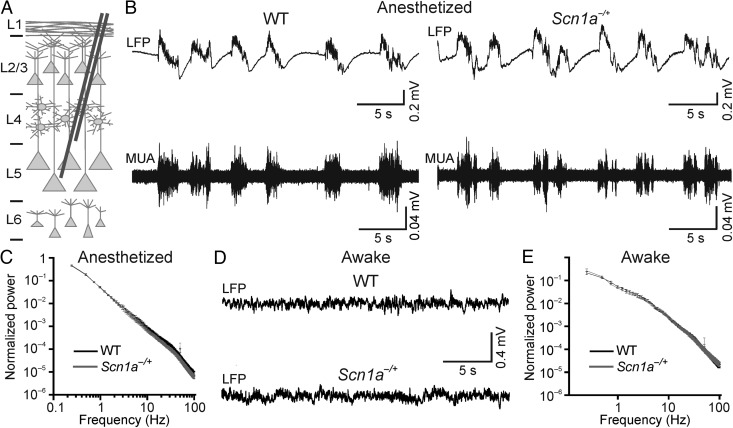
Cortical network dynamics in WT and Scn1a−/+ mice in vivo. (A) Schematic representation of experimental configuration. Recording electrodes were placed at approximately 700 µm depth. (B) Representative traces of LFP (top traces) and MUA (bottom traces) activity in anesthetized WT (left) and Scn1a−/+ (right) mice during spontaneous activity. (C) Average normalized LFP power spectra for WT (N = 18) and Scn1a−/+ mice (N = 17). (D) Representative traces of LFP in awake head-restrained WT (top) and Scn1a−/+ (bottom) mice showing spontaneous activity. (E) Average normalized LFP power spectra in awake, head-restrained mice. WT, N = 15; Scn1a−/+ mice, N = 15.

