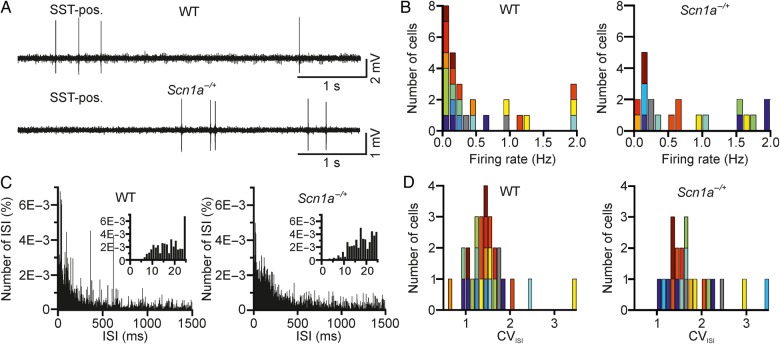
Figure 10.
Two-photon-guided juxtasomal recordings from SST-positive interneurons in vivo. (A) Juxtasomal recording from a Tomato- and SST-positive cell in anesthetized WT (top) and Scn1a−/+ (bottom) mice. (B) Distribution of the average firing rate of recorded cells in WT (left, N = 27 cells from 12 different animals) and Scn1a−/+ (right, N = 21 cells from 11 different animals). The color code indicates cells recorded in different animals. (C) Average (over cells) distribution of the ISI in WT (left) and Scn1a−/+ (right) for the same set of recordings analyzed in B. Bin, 1 ms. The distributions are shown at an expanded time scale in the insets. (D) Distribution of the CVISI in WT (left) and Scn1a−/+ (right). Same color code as in C.

