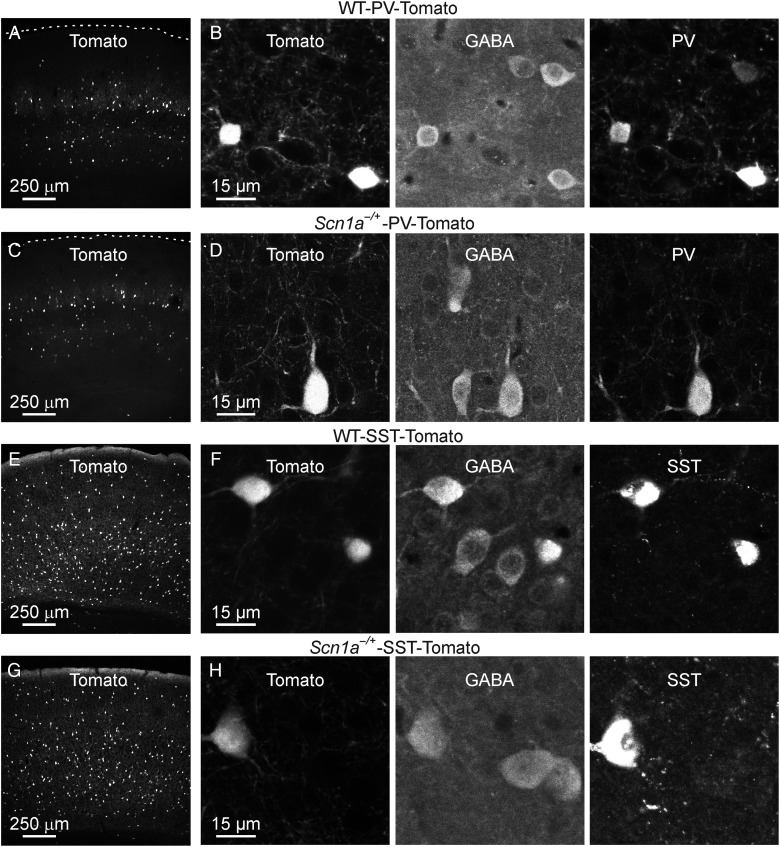
Figure 2.
Identification of genetically specified subclasses of interneurons in WT and Scn1a−/+ mice. (A) Confocal image showing Tomato fluorescence in a section from the cortex of a WT-PV-Tomato mouse. (B) A zoom in of 2 Tomato-positive cells is shown in the leftmost panel. The section shown in (B) was stained against GABA (middle panel) and PV (rightmost panel). (C and D) Same as in A and B for Scn1a−/+-PV-Tomato. (E and F) Same as in A and B for WT-SST-Tomato. (G and H) Same as in A and B for Scn1a−/+-SST-Tomato.

